

Sponsor directories are useful for understanding which kinds of vendors are visible around an event. They do not prove market share, investment flow, buyer demand, or the composition of all attendees.
This briefing analyzes a frozen set of 312 Money20/20 USA 2026 sponsor-directory records captured for TechCurrent research. The live directory has since changed, so this should be read as a dated snapshot rather than a complete census.
Dataset and method
- Source: Money20/20 USA 2026 sponsor directory.
- Rows: 312 unique company names and 312 unique official profile URLs.
- Category field: Counts use the industry labels supplied in the directory snapshot; TechCurrent normalized display names but did not infer company revenue mix.
- Snapshot integrity: SHA-256
5293A3A52087D3C89DE99E2B93CEBC72FBED53F1BCEC7131009188BCE07F7B58. - Limitation: The live directory may add, remove, or recategorize records. No historical comparison is used here.
Category distribution (N=312)
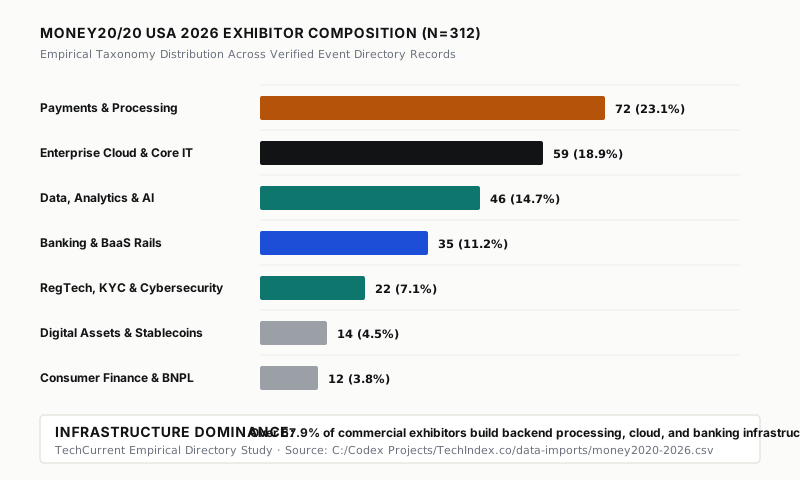
| Rank | Directory category | Records | Share |
|---|---|---|---|
| 1 | Payments & Payments Technology | 72 | 23.1% |
| 2 | Software / IT / Cloud Services | 59 | 18.9% |
| 3 | Data, Analytics & AI | 46 | 14.7% |
| 4 | Banking | 35 | 11.2% |
| 5 | Other | 19 | 6.1% |
| 6 | Blockchain & Cryptocurrencies | 14 | 4.5% |
| 7 | Advisory & Professional Services | 13 | 4.2% |
| 8 | RegTech / SupTech | 12 | 3.8% |
| 9 | Cyber Security | 10 | 3.2% |
| 10 | Consumer Tech | 6 | 1.9% |
| 11 | Government & Regulatory Bodies | 5 | 1.6% |
| 12 | Investment / VC / PE | 4 | 1.3% |
| 13 | Retail / Marketplaces / Merchants | 4 | 1.3% |
| 14 | Telecoms & Mobile | 4 | 1.3% |
| 15 | Lending | 3 | 1.0% |
| 16 | Insurance & InsurTech | 2 | 0.6% |
| 17 | Personal Finance & Roboadvisory | 2 | 0.6% |
| 18 | Trade Associations | 2 | 0.6% |
| Total | All records in the snapshot | 312 | 100.0% |
What the snapshot supports
Payments and enterprise software are the two largest groups
Payments and Software / IT / Cloud Services total 131 records, or 42.0%. That makes them the clearest starting points for attendees looking for payment rails, infrastructure, cloud systems, or enterprise software vendors.
Five selected infrastructure categories make up 60.3%
Payments (72), Software / IT / Cloud Services (59), Banking (35), RegTech / SupTech (12), and Cyber Security (10) total 188 records. That is 60.3% of this snapshot—not 67.9% and not “over two-thirds.”
The grouping is an editorial lens. Readers may reasonably define “infrastructure” differently, so the five included categories are stated explicitly.
AI is prominent, but the label is broad
The directory labels 46 records as Data, Analytics & AI. The category alone does not show whether AI is a core product, a feature, or a positioning choice. Company-level review is required before drawing that distinction.
Consumer-oriented categories are a small share of this snapshot
Consumer Tech (6), Retail / Marketplaces / Merchants (4), and Personal Finance & Roboadvisory (2) total 12 records, or 3.8%. Without a comparable prior-year dataset, this does not establish contraction or explain why the mix looks this way.
How to use the data
Use the distribution to narrow research, then verify individual companies in the live event directory and their official product documentation. Do not treat category counts as evidence of quality, market leadership, buyer intent, or recommended vendor status.